
FDD & Financial Analysis
Item 19 by quartile, the true fee load, unit economics where payroll is 45% of revenue, and why EBITDA and EBITDAR tell different stories.
Item 19 Quartile Breakdown
| Quartile | Avg. Gross Revenue | % of System Average | Facilities in Range |
|---|---|---|---|
| Top 25% | $3,812,543 | 140% | 125 |
| Second 25% | $2,873,761 | 105% | 125 |
| Third 25% | $2,429,591 | 89% | 125 |
| Bottom 25% | $1,790,885 | 66% | 124 |
| System Average | $2,728,570 | 100% | 499 |
Source: 2025 Primrose Schools Franchise Disclosure Document, Item 19. Based on 499 active facilities reporting CY2024 gross revenue. The 2.1x spread between top and bottom quartile means the system average tells prospective investors almost nothing about what their location will actually generate. See the full quartile revenue breakdown for a P&L walkthrough at each quartile. Note: these figures reflect CY2024 performance under Roark Capital’s ownership — see the PE ownership transition analysis for what the March 2026 sale to Taurus Capital Partners means for forward-looking models. For the latest data, see the 2026 FDD year-over-year analysis covering CY2025 performance across 558 schools.
The Stacked Fee Load
Primrose’s franchise fee structure is more complex than it appears on the summary page. The royalty alone — 7% of gross revenue — is the headline number, but four separate fees stack on top of each other and collectively consume 11–13% of every dollar your school generates.
The brand fund runs at 2% today with a contractual ceiling of 3%. The local advertising requirement is 1% of gross or a $1,000 monthly minimum, whichever is greater. And the co-op advertising fee adds another 1% with an upper bound of 2%, triggered when your market has enough schools to form a cooperative.
On the system average of $2.73M, that 11–13% fee load translates to $300K–$355K per year flowing to the franchisor and mandated marketing funds before you pay a single teacher, cover rent, or service debt. At top-quartile revenue of $3.81M, the dollar amount climbs to $419K–$495K — a figure that competes with your total payroll cost for teaching staff.
The key modeling question: which fees are fixed-rate and which have contractual escalation clauses? The brand fund’s 2-to-3% range means an additional $27K–$38K annually could materialize with a single franchisor decision, no renegotiation required. See the full fee stack breakdown for the math at every revenue quartile and a head-to-head comparison with Goddard and Kiddie Academy.
On $2.73M avg. revenue: $300K–$355K/year
Unit Economics P&L
Child care is a labor-intensive business, and Primrose’s economics reflect it. Payroll — teachers, assistant teachers, administrative staff, and the director — consumes roughly 45% of gross revenue at the system average. That single line item dominates the P&L in a way that fitness, food, or service franchises never experience.
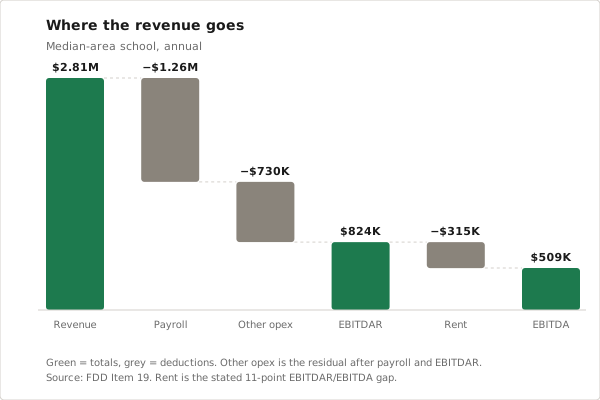
At the median-area school generating $2,814,801 in annual revenue, payroll runs approximately $1,260,772. Add the 11–13% fee load, occupancy costs, supplies, insurance, and maintenance, and you arrive at an EBITDAR of $824,034 (29%) and an EBITDA of $508,975 (18%).
The 11-point gap between EBITDAR and EBITDA is rent. Primrose schools require purpose-built or heavily renovated facilities ranging from 9,000 to 13,000 square feet, typically on owned or long-leased land. That real estate cost — whether expressed as lease payments or mortgage service — is the second-largest expense after payroll and the primary reason EBITDA tells a materially different story than EBITDAR.
Payroll Sensitivity Modeling
Because payroll is 45% of revenue in the base case, even small shifts have outsized effects on the bottom line. At 48% payroll (tight labor market, wage pressure, or lower enrollment spread across fixed staff), EBITDA drops to roughly $424K — a 17% decline. At 50% payroll (aggressive minimum wage increases, high turnover with overtime and agency costs), EBITDA compresses to approximately $368K, a 28% decline from the base case. These are not edge scenarios — they are the range most operators will experience across the enrollment cycle.
Investment Range
Item 7 of the FDD breaks the initial investment into discrete components. The range is wide — driven primarily by real estate, construction, and regional cost variation.
The initial franchise fee ranges from $50,000 for a standard single-unit agreement to $80,000 depending on territory and multi-unit commitments. This is a one-time, non-refundable payment due at signing. Multi-unit developers may negotiate reduced per-unit fees on subsequent locations, but the first unit is typically at full rate.
A separate $25,000 real estate fee covers Primrose’s site selection support, demographic analysis, and facility design consultation. This fee is in addition to the franchise fee and is required regardless of whether you use their recommended real estate broker or find a site independently.
The enormous range reflects the difference between leased versus owned real estate. Leased locations may require $15,000–$50,000 in security deposits. Owner-operators purchasing land and building can face deposits of $100,000–$250,000 across construction loans, utility connections, and lease guarantees for equipment. This is the single widest line item in the investment range and the primary driver of the $743K-to-$1.53M total spread.
Equipment covers classroom furniture, age-appropriate learning materials, playground equipment, kitchen/food-service fixtures, security systems, and technology infrastructure. Primrose specifies approved vendors for most categories, limiting your ability to value-engineer this line item. The $70K range within equipment is driven primarily by facility size (number of classrooms) and whether the kitchen is full-service or warming-only.
Training costs cover the owner/director’s initial training program at Primrose headquarters, plus travel, lodging, and meals during the training period. This also includes the cost of on-site pre-opening training for your initial staff. The amount is relatively fixed regardless of market — everyone goes through the same program.
Initial marketing covers pre-opening enrollment campaigns, grand opening events, signage, local digital advertising, and community outreach. The wide range reflects market-dependent media costs and the length of the pre-enrollment period. Schools in competitive child care markets with established incumbents typically need to spend at the higher end to build a waitlist before opening day. Effective pre-enrollment is the single strongest predictor of first-year financial performance.
Three months of operating funds cover payroll, rent, utilities, insurance, and supplies during the ramp-up period when enrollment has not yet reached cash-flow breakeven. The $240K range is driven by facility size, local wage rates, and lease costs. In practice, most schools take 12–18 months to reach full enrollment, meaning three months of reserves is a minimum — prudent operators plan for six months or negotiate a line of credit to cover the gap.
Modeling Your Capital Stack?
A $743K–$1.53M investment with 45% payroll and an 11-point EBITDAR/EBITDA gap requires precise capital structure planning. SBA 504 changes the math when real estate is involved.
Compare SBA financing options →