The $20K Tuition Filter: How to Know Whether Your Market Can Actually Support a Goddard School
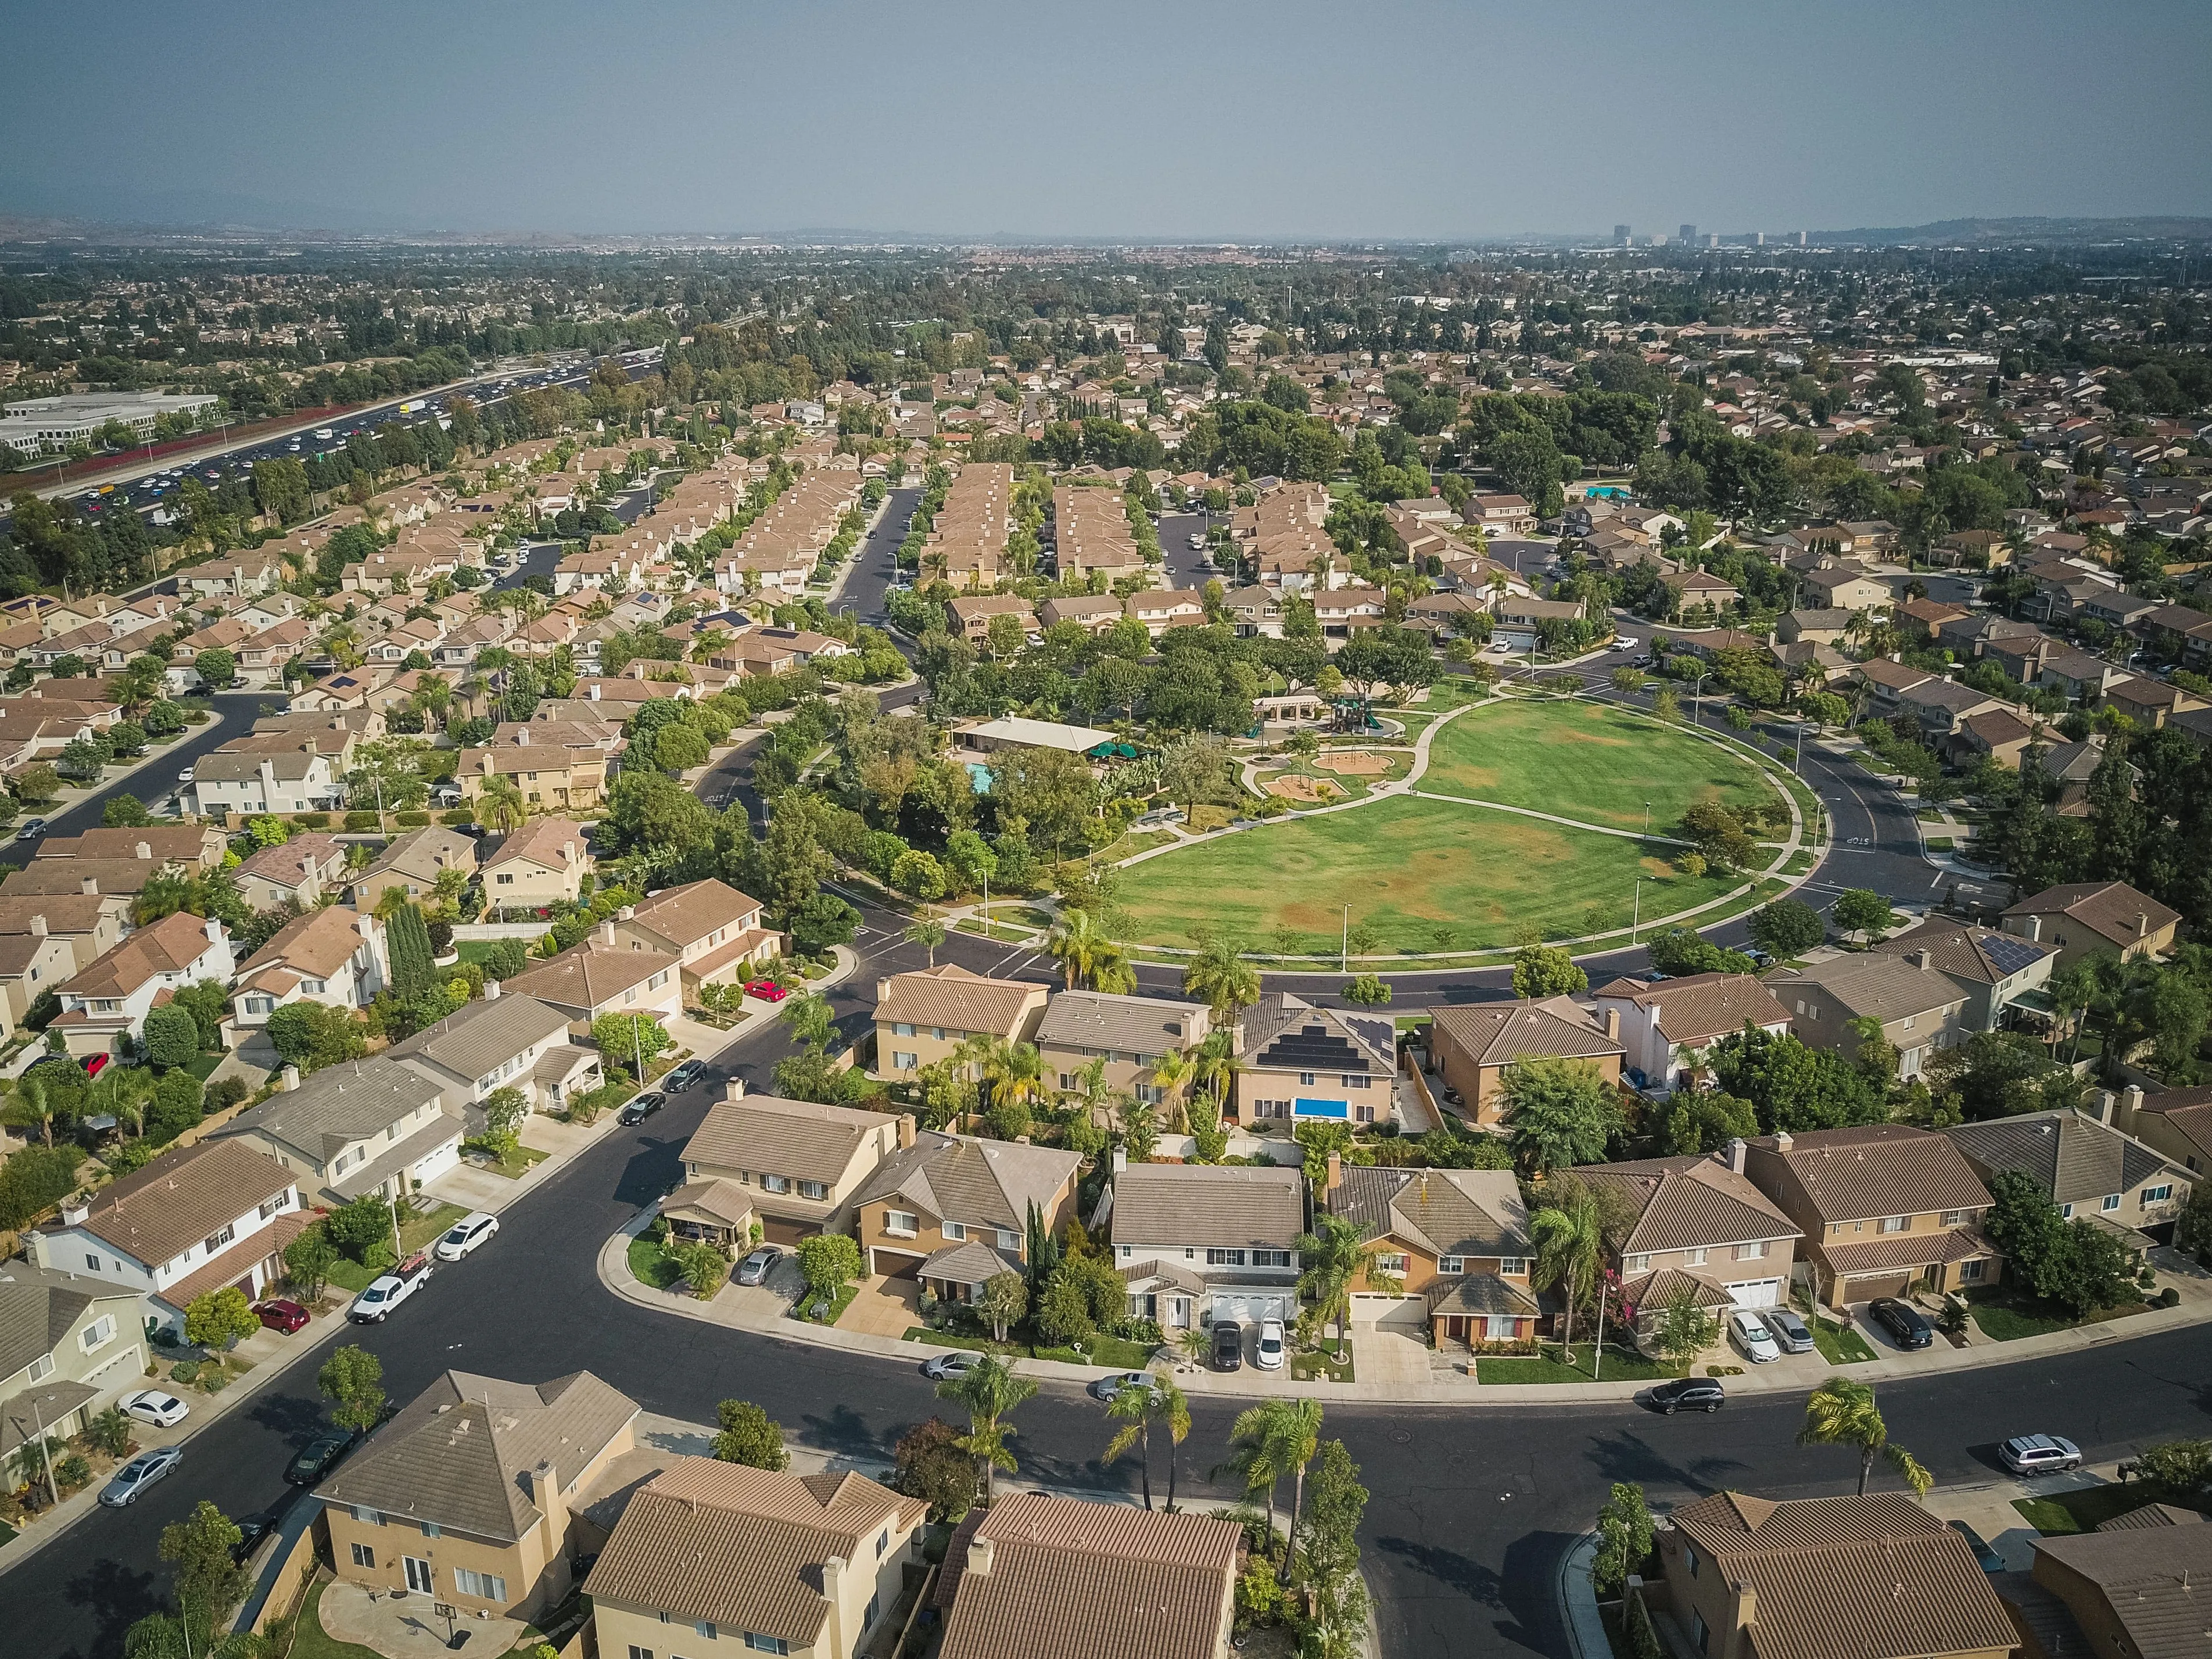
Goddard Charges $20,000+ Per Child Per Year. That Is Not a Childcare Price — It Is a Demographic Filter.
The site selection question is not whether your area needs childcare. It is whether enough families within a five-mile radius can write that check every month while the commercial real estate underneath you supports the build-to-suit economics.
Fifty-one percent of census tracts in the United States are childcare deserts. That is the number that appears in every franchise development pitch, every market analysis summary, every reason a childcare franchise should be expanding. Goddard Systems has licensed new schools in 37 states and is actively growing. The demand story is real.
But the demand story and the Goddard story are not the same story.
A childcare desert is a census tract with more than three children under five for every licensed childcare slot. The metric does not distinguish between a neighborhood where families earn $45,000 and need subsidized care, and a suburb where dual-income households earn $250,000 and will pay $20,000 a year for a curriculum-driven preschool with a STEAM lab and a parent communication app. Both tracts are deserts. Only one of them can support a Goddard School.
The real site selection question for a premium childcare franchise is layered: does this area have enough families who can pay $20,000 or more per child per year, and is the commercial real estate market in that area priced at a level that supports an 8,000-to-12,000-square-foot build-to-suit lease without eating the unit economics? Those are two filters, and a market has to pass both.
This article walks through what the filters actually require, how to run the numbers on a specific market, and where the analysis breaks down.
The Income Filter: What $20,000 Per Year in Tuition Actually Requires
Start with the household math. Financial advisors generally recommend that childcare spending not exceed 7% to 10% of gross household income. At $20,000 per year, that guideline implies a household income of $200,000 to $285,000 to stay within the recommended range.
In practice, families stretch. A dual-income household earning $150,000 can allocate $20,000 to childcare — it represents 13% of gross income, which is tight but not uncommon in high-cost metros where families have already accepted that childcare is their largest expense after housing. The practical floor for one child at Goddard pricing is a household income of roughly $130,000 to $150,000, assuming the family is willing to prioritize and has no other major childcare expense.
For two children — and the average Goddard family has 1.4 children enrolled — the arithmetic shifts hard. Two children at $20,000 each is $40,000 per year. At 10% of gross income, that requires $400,000 in household earnings. Even at a stretched 15%, the household needs $267,000. The two-child family is Goddard’s best revenue unit but its narrowest demographic funnel.
What this means for site selection: you need to know not just the median household income of a census tract, but the distribution above $150,000. Census ACS data provides this at the tract level — Table B19001 breaks household income into brackets, and what matters is the count of households in the $150,000 to $199,999 and $200,000-and-above brackets relative to the count of children under five (Table B09001).
The metro-versus-suburban distribution matters here. In a dense urban core, household incomes above $150,000 may be common, but those families also have access to more childcare options, higher-end nanny services, and corporate backup care. In outer suburbs and exurbs, the income distribution may skew lower, but families with means have fewer options and are more likely to drive for quality. Goddard’s strongest markets have historically been inner-ring suburbs of major metros — places where high incomes concentrate, commute patterns create demand for reliable care near highways, and competitive alternatives are thinner than in the urban core.
The Supply Side: Competitive Mapping
A market can have the right income profile and still be wrong for Goddard if the supply side is already saturated.
The competitive set for a Goddard School is not all childcare. It is the premium tier: centers charging $15,000 or more per year, with structured curricula, branded facilities, and a parent experience designed for dual-income professional households. That means:
- KinderCare / KLC — $15,000 to $18,000 per year in most markets. The largest childcare operator in the country by center count. Not positioned as premium, but their pricing overlaps with Goddard’s floor in lower-cost metros.
- Primrose Schools — $16,000 to $22,000 per year. The closest direct competitor to Goddard in positioning, pricing, and parent demographic. See the competitive landscape analysis for a detailed comparison.
- Kiddie Academy — $14,000 to $19,000 per year. Positioned slightly below Goddard and Primrose, capturing the upper-middle tier.
- Lightbridge Academy — $17,000 to $23,000 per year. Smaller footprint, concentrated in the Northeast, but directly competitive where it operates.
- Independent Montessori schools — $18,000 to $28,000 per year. Pricing often exceeds Goddard but the model differs structurally. These pull from the same income demographic.
Goddard’s internal density guideline is approximately one school per 10,000 households in a given market area. That guideline exists to protect existing franchisees from cannibalization, but it also tells you something about how much demand a single school can capture. At 10,000 households, if 15% earn above $150,000, you have 1,500 addressable households — before accounting for the ones already enrolled elsewhere, the ones with children outside the age window, and the ones who prefer a different model.
Map every licensed center within a five-mile radius of your proposed site. Your state’s childcare licensing database — every state maintains one, and most are searchable online — will give you the licensed capacity and address of every facility. Then price-check the top ten by enrollment fees. If you find three or more centers in the $18,000+ range within three miles, you are looking at a saturated premium market, not a desert.
The Commercial Real Estate Filter
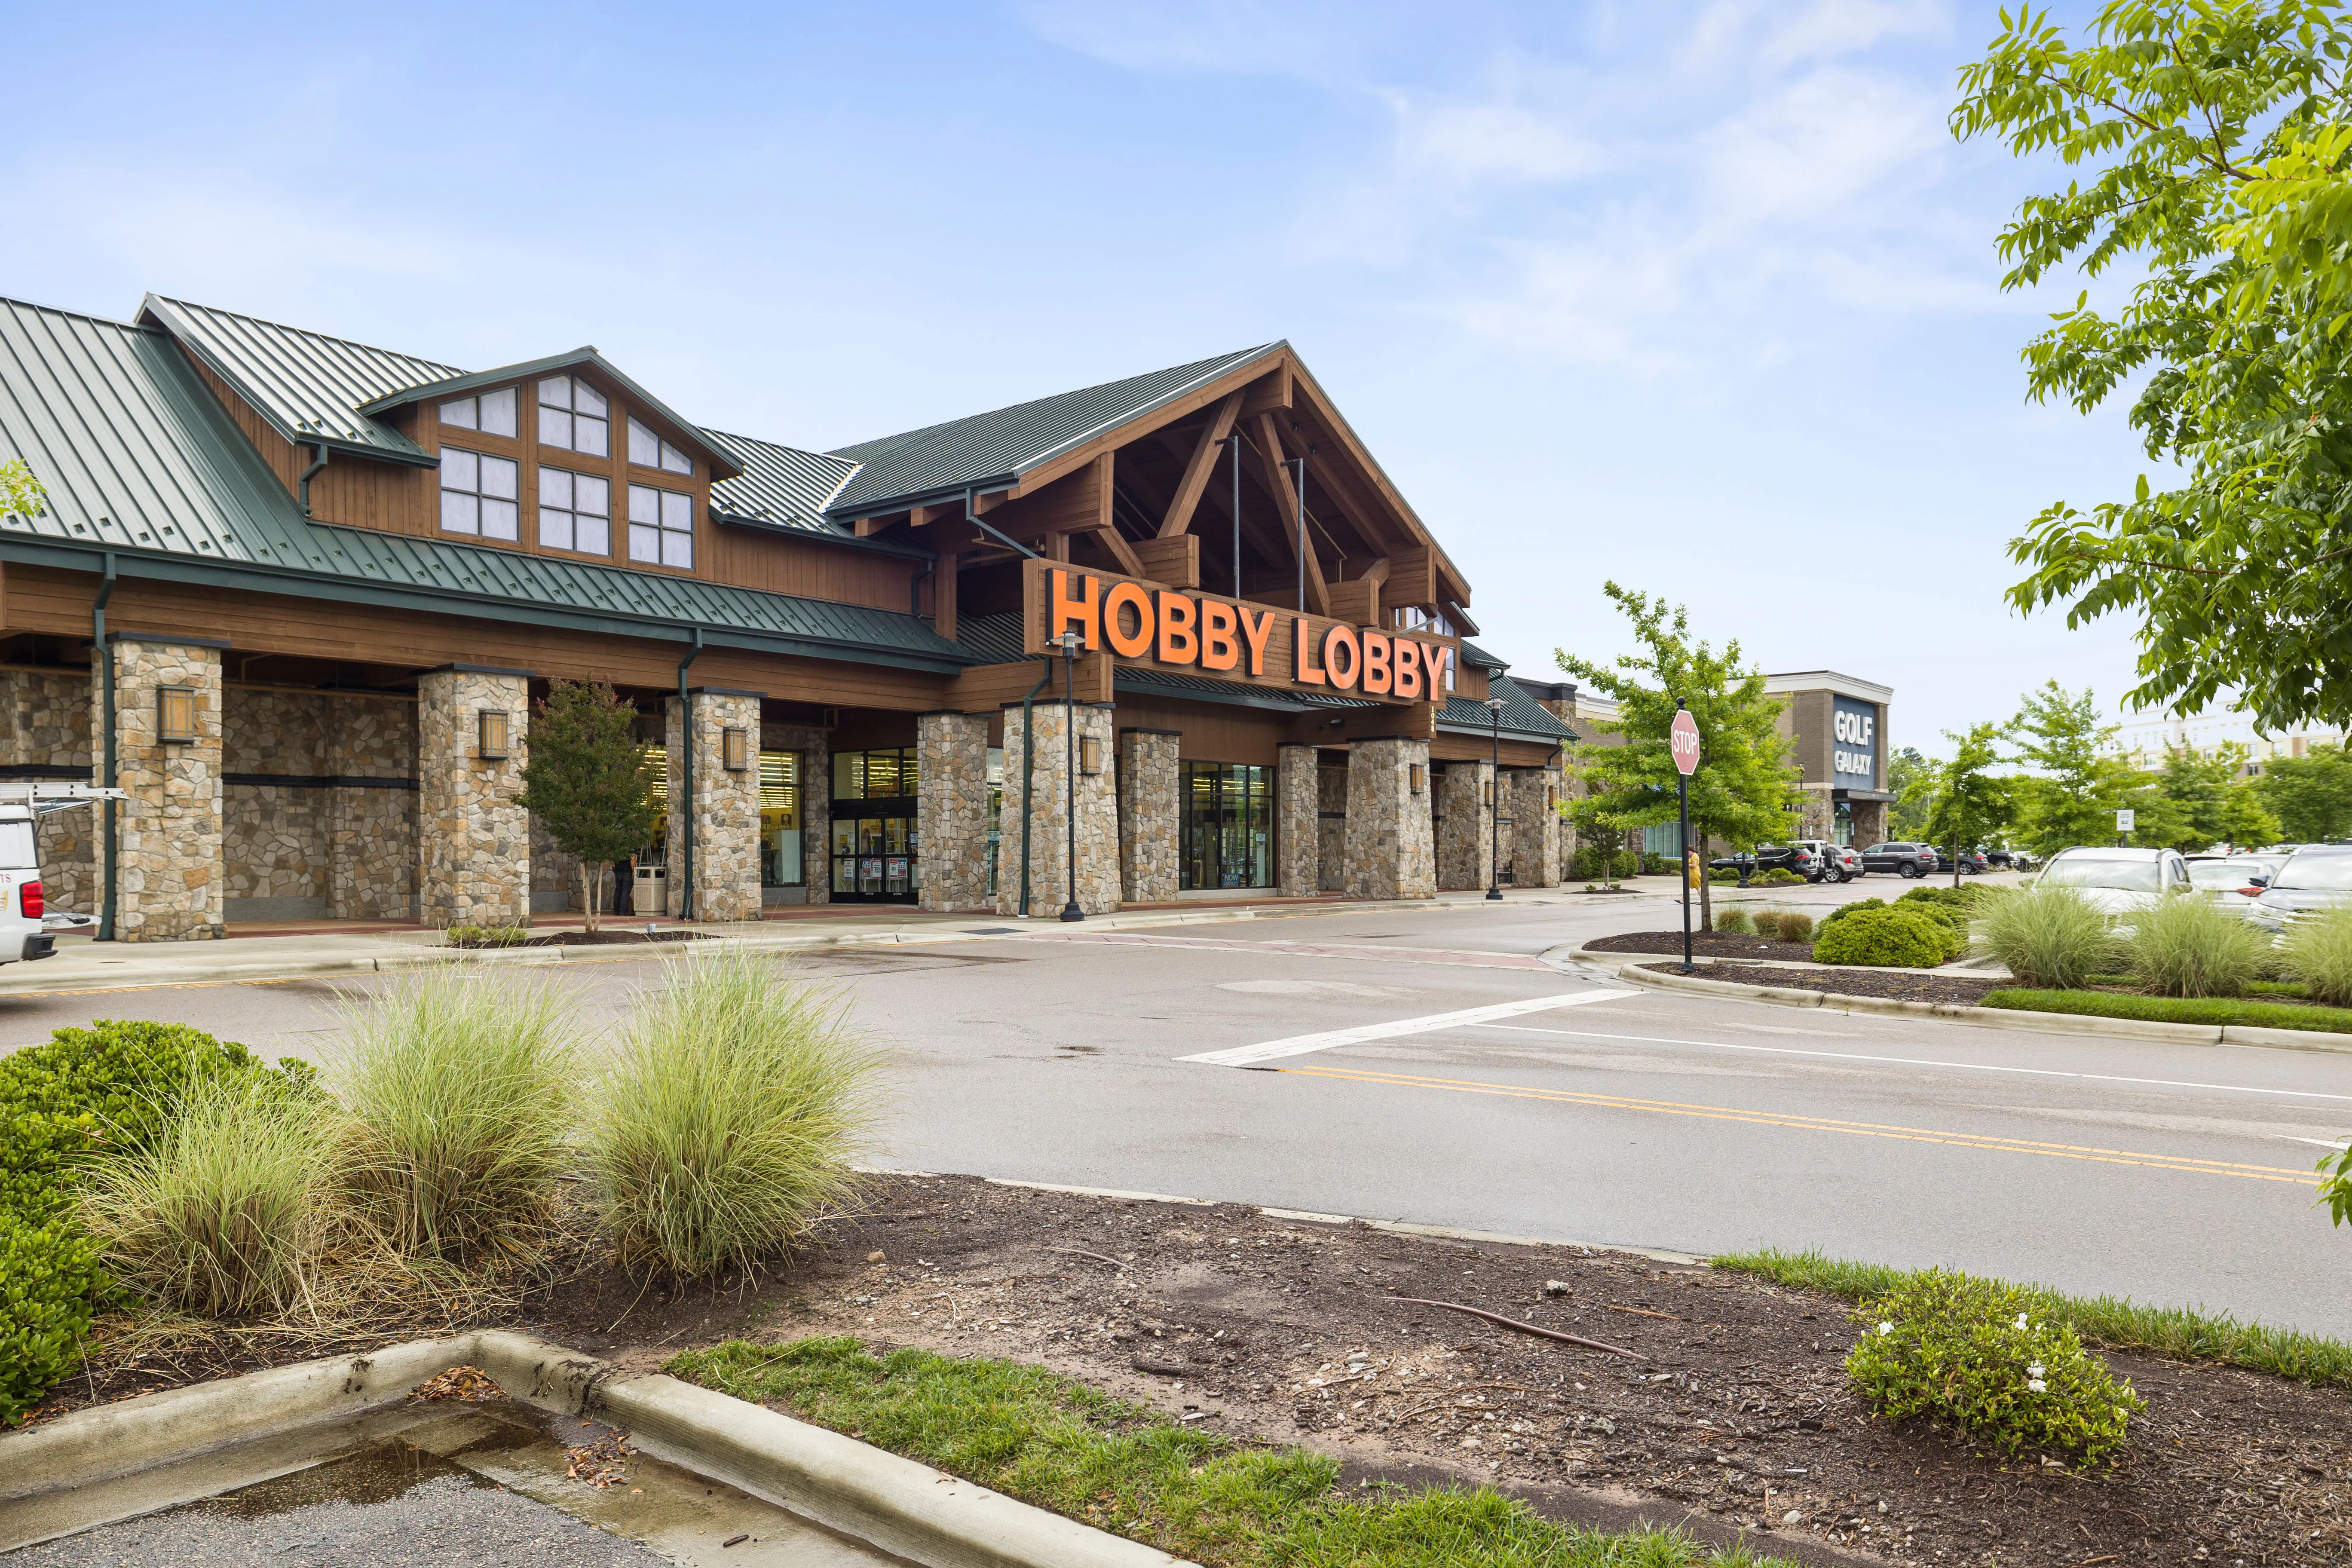
Goddard’s build-to-suit model requires 8,000 to 12,000 square feet of purpose-built or retrofitted space. The school cannot operate in a strip mall suite or a converted house — state licensing codes require specific room dimensions, outdoor play areas, commercial kitchen facilities, and parking ratios that rule out most existing commercial inventory.
That means you are negotiating a build-to-suit or major retrofit lease in a suburban commercial real estate market. Current NNN lease rates in the suburban corridors where Goddard operates range from $18 to $30 per square foot, depending on the metro area and the specific submarket.
The annual lease cost math:
| Building Size | Lease Rate | Annual Lease Cost |
|---|---|---|
| 8,000 SF | $18/SF | $144,000 |
| 10,000 SF | $24/SF | $240,000 |
| 12,000 SF | $30/SF | $360,000 |
At Goddard’s median revenue of approximately $2.3 million, a $240,000 annual lease represents 10.4% of gross revenue — a rent-to-revenue ratio that most franchise financial models consider the upper edge of healthy for a childcare operation. At $360,000, you are at 15.7%, which compresses every other line item in your P&L.
This is where the two filters intersect. A market with high household incomes but also high commercial rents may pass the income filter and fail the economics filter. Northern New Jersey, parts of the D.C. suburbs, and coastal California corridors have the demographics but lease rates that push the rent-to-revenue ratio past workable levels unless enrollment and pricing both hit the upper quartile. The three investment paths analysis details how each real estate structure absorbs these costs differently.
The Build-to-Suit Economics: What the Site Itself Demands
Beyond the lease rate, the site selection decision involves several variables that directly affect your capital timeline and your ability to open on schedule.
Landlord TI Allowances
In competitive suburban markets, landlords may offer $40 to $80 per square foot in tenant improvement allowances on a build-to-suit childcare lease. That allowance offsets your interior fit-out costs, which run $150 to $250 per square foot for a licensed childcare center. The spread between TI allowance and actual fit-out cost is your cash requirement. In a market where landlords are offering $40/SF on a $200/SF fit-out, you are covering $160/SF out of pocket or through your SBA loan. In a market where the allowance hits $80/SF, that gap shrinks to $120/SF — a difference of $400,000 on a 10,000-square-foot building.
Zoning
Childcare facilities require a conditional use permit or special exception in most suburban zoning districts. The hearing is not automatic — neighbors object, traffic studies get commissioned, and the process takes 3 to 9 months depending on the jurisdiction. Some municipalities have streamlined childcare zoning in response to the desert data. Others have made it harder, especially in residential-adjacent commercial zones where parent drop-off traffic is a documented concern. Research the zoning before you sign anything.
Parking and Outdoor Space
State licensing codes specify minimum outdoor play area per enrolled child — typically 75 to 100 square feet per child. For a 120-child school, that is 9,000 to 12,000 square feet of outdoor space, fenced, shaded, with age-appropriate surfaces. Add the parking ratio — typically one space per five to eight children plus staff parking — and you need a site with substantial land area beyond the building footprint. This eliminates most infill commercial parcels and pushes you toward suburban pad sites or larger mixed-use developments.
Permitting Timeline
From zoning application to certificate of occupancy, the full permitting arc runs 6 to 18 months. California, New York, and parts of New England sit at the long end. Texas, the Carolinas, and much of the Southeast run faster. This timeline is money — every month between lease signing and opening is a month of carrying costs with zero revenue. The enrollment ramp timeline explains how those carrying costs compound.
For a detailed look at what the physical build requires across all three investment structures, see the real estate and build-out analysis.
The Demand Model: Running the Numbers on a Specific Market
Here is how to build a market-specific demand model using publicly available data.
- Define the catchment area. Goddard families typically drive 5 to 15 minutes. In suburban markets, a five-mile radius approximates this. In denser areas, shrink to three miles. Pull every census tract that falls within that radius.
- Count the children. Census ACS Table B09001 gives the population under 5 by tract. Sum the tracts in your catchment. Call this number T.
- Count the income-qualified households. ACS Table B19001 gives household income distribution by bracket. Sum the households earning $150,000 or more across your catchment tracts. Call this number H.
- Estimate address-eligible children. Not every high-income household has a child under 5. The ratio varies by market — in young suburban communities it can be 20% to 25% of high-income households; in established neighborhoods it may be 10% to 15%. Apply the local ratio. Call this number E.
- Apply the enrollment math. A Goddard School at capacity enrolls approximately 120 children. At 85% average occupancy — a realistic stabilized target — you need 102 enrolled families. If you can capture 2% to 3% of the age-eligible children in income-qualified households, you need E to be at least 3,400 to 5,100 children.
- Check the labor force participation rate. ACS Table B23003 gives labor force participation for parents with children under 6. A market where 75% of parents with young children are in the labor force has fundamentally different childcare demand than one where 55% are — the second market has more stay-at-home parents and correspondingly less need for full-day premium care. This variable can shift the demand model by 30% or more.
Work it backward: if your catchment area has 8,000 children under 5, and 30% of them live in households earning $150,000+, your income-qualified pool is 2,400. At 3% market penetration, you enroll 72 children — below the 102 needed for stabilized occupancy. That market is marginal for Goddard.
If the same area has 15,000 children under 5 and 35% income-qualification, your pool is 5,250. At 2% penetration, you enroll 105 — viable. That is the market.
The BLS childcare industry data provides additional context on regional staffing availability, which affects both your cost structure and your ability to operate at full capacity.
The Three Warning Signs
After running the filters, watch for these patterns that look attractive on the surface but break down under scrutiny.
Warning 1: High Demand, Low Income
The most common trap. A census tract shows 500 children under 5 and only 40 licensed childcare slots — a childcare desert by any definition. But the median household income is $62,000. Families here need affordable care, possibly subsidized care. They do not need a $20,000 preschool. Goddard cannot serve this market, and attempting to would produce a school that cannot fill classrooms at its required price point.
This is not a criticism of the market or its families. It is a statement about product-market fit. A premium childcare franchise and a childcare desert are addressing different problems, and conflating them leads to site selection decisions that fail.
Warning 2: Right Income, Saturated Supply
A suburban corridor with median household income of $180,000 and 12,000 children under 5. On paper, ideal. But a competitive survey reveals two Primrose schools, a Goddard already operating, a Kiddie Academy, and six Montessori programs within four miles. The income-qualified pool is being served. The territory growth dynamics piece examines how Goddard’s own expansion pace affects density in established markets.
A saturated premium market does not mean zero opportunity — turnover happens, populations shift, and a school with a better site or a better operator can take share. But it means your enrollment ramp will be longer, your stabilized occupancy may plateau lower, and you are competing for families rather than filling a void. That changes the financial model materially.
Warning 3: Rising Rents, Flat Incomes
A market where commercial lease rates have grown 5% to 8% annually over the past three years while household income growth in the catchment area has been 2% to 3%. The gap means your occupancy cost is growing faster than your pricing power. Today the rent-to-revenue ratio works. In year five of a 15-year lease with annual escalators, it may not.
This is particularly acute in the suburban corridors that Goddard targets. Class A suburban retail and office rents have risen sharply in markets where remote and hybrid work has driven residential demand outward. The same population shift that creates childcare demand also inflates the real estate underneath it. Run the lease economics forward, not just at signing.
The Practical Checklist: Eight Data Points Before You Sign
Before committing capital to a Goddard site, gather these. Each one is available from public sources or through standard commercial real estate due diligence.
- Census ACS income distribution — Table B19001 for every tract within five miles. Count households at $150K+ and $200K+. This is the top of your funnel.
- Children under 5 by tract — Table B09001. Cross-reference with the income data to estimate income-qualified children in the catchment.
- Labor force participation for parents — Table B23003. A market with sub-60% participation has structurally lower demand for full-day care.
- State licensing database — Every licensed childcare center within five miles: name, address, capacity. This is your supply map. Pricing requires phone calls or website research.
- Commercial rent comps — NNN lease rates for 8,000-to-12,000-SF spaces in the target submarket. Your broker can pull these; verify with at least three recent transactions, not just listings.
- Existing Goddard density — Check Goddard’s school locator. How many schools already operate within 10 miles? Goddard’s territory protections are defined in the franchise agreement, but operational density affects your enrollment ceiling regardless of what the contract says.
- School district enrollment trends — Local school districts publish enrollment data annually. Declining K–2 enrollment in the target area may signal a demographic shift that will reach the under-5 cohort in two to three years.
- County population projections — Most county planning departments publish five-year and ten-year population projections by age cohort. A site that works today but sits in a tract with projected population decline is a 15-year commitment in a shrinking market.
Franchise financing specialists like Lendesca can help model how these market variables affect debt service coverage at different revenue scenarios — the enrollment ramp alone can shift DSCR below lender thresholds for 18 months, and that is before accounting for market-specific pricing pressure. But the demographic work is yours to do first. No lender can fix a site that the income data does not support.
An SBA 7(a) loan will be the primary financing vehicle for most Goddard franchisees, and SBA underwriters will scrutinize the market data as part of their credit analysis. Having the census work, competitive survey, and lease economics assembled before you approach a lender compresses the underwriting timeline and reduces the risk of surprises at the commitment stage.
The Filter Works Both Ways
The $20,000 tuition filter narrows the market for Goddard. That is a limitation. It is also, if you are on the right side of the filter, a moat. A market that passes both the income test and the supply test — enough high-earning families, not too many premium competitors — is a market where Goddard’s pricing power is protected by the same demographics that make it viable.
The childcare desert data is real. The expansion opportunity is real. But “this area needs childcare” and “this area can support a Goddard School” are different statements, and the gap between them is where site selection mistakes happen. The families who need care the most are often in markets that cannot support premium pricing. The markets that can support premium pricing may already have premium supply.
The analysis is not complicated. It is Census data, a state licensing database, and a commercial rent comp — three data sources, two hours of work, and a spreadsheet. Do it before the site tour, before the LOI, and before you fall in love with a building. The numbers either work or they do not, and no amount of conviction about the childcare shortage changes the household income distribution in a five-mile radius.