October 2026
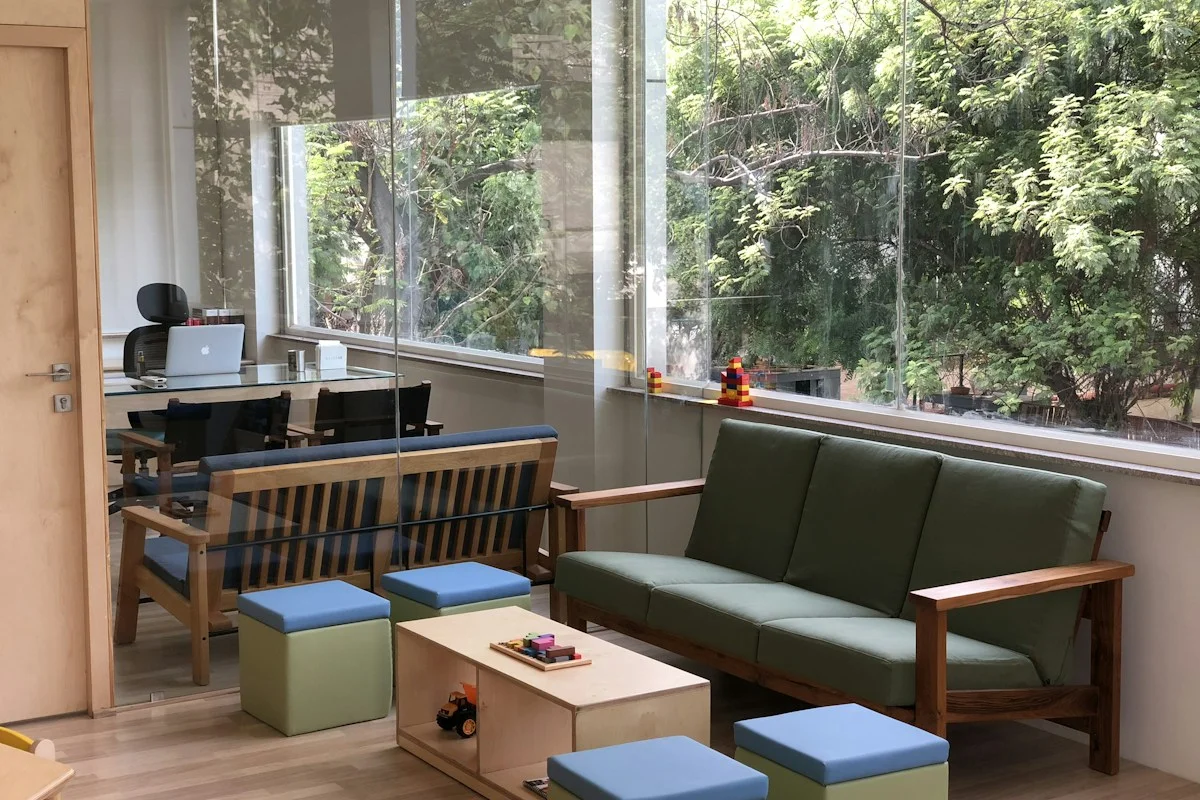
The Technology Divide: How AI Enrollment, Scheduling, and Compliance Tools Are Splitting Childcare Into Winners and Losers
AI enrollment agents, predictive scheduling, automated compliance. Centers using AI cut admin overhead 34%. What Primrose provides vs. what you'll buy yourself.
Read →
Discovery Day Intelligence: What Primrose’s Headquarters Visit Actually Reveals, What It Deliberately Doesn’t, and the 12 Things to Observe Before You Leave
Discovery Day is a sales presentation. These 12 observations and the questions that generate the most revealing answers turn it into a due diligence operation.
Read →
Primrose vs The Field: An Apples-to-Apples Comparison With Goddard, Kiddie Academy, and KinderCare That Actually Counts All the Fees
Every comparison quotes the 7% royalty. The real fee load is 11-13%. Side-by-side analysis with Goddard, Kiddie Academy, and KinderCare — fees, revenue, and owner earnings.
Read →
The Pre-Opening Marathon: 24–36 Months of Capital Deployed Before Your First Dollar of Revenue
Site selection, permitting, construction, hiring — 24-36 months of capital deployed before opening day. Add the enrollment ramp and it's 42-60 months to cash flow.
Read →
The Affordability Death Spiral: When Rising Tuition, Falling Enrollment, and Educator Wage Pressure Converge Inside Your Primrose P&L
Low wages drive teacher departures, which cuts capacity, which cuts revenue, which prevents wage increases. How the loop works — and what breaks it.
Read →
The Enrollment Funnel: What It Actually Costs to Fill 300 Seats, Why Your Marketing Budget Is Wrong, and the Metric That Matters More Than Conversion
$45-$110 to acquire each family. 16% churn = 48 replacements per year. Q1 2026 leads down 6%. The enrollment economics that should be in every Primrose pro forma.
Read →
The Licensing Lottery: How State Childcare Regulations Create a 67% Staffing Cost Gap Between Your Best and Worst Primrose Territory
Infant ratios of 1:3 vs 1:5 mean 67% more staff in strict states. See how licensing creates a $200K-$400K payroll swing between Primrose territories.
Read →
The CCDF Reversal: Why the July 2026 Rule Change Makes Your Subsidy Revenue a Monthly Coin Flip
The May 2026 CCDF rule lets states revert to attendance-based childcare payments. What that means for Primrose owners with 20-40% subsidized enrollment.
Read →
The Insurance Cost Stack: $35K–$65K in Annual Premiums That Never Appear in the FDD’s Investment Range
Seven required policies stack to $35K–$65K/year for a Primrose franchise. Workers' comp alone runs $24K–$43K. Here's every line item the FDD doesn't show you.
Read →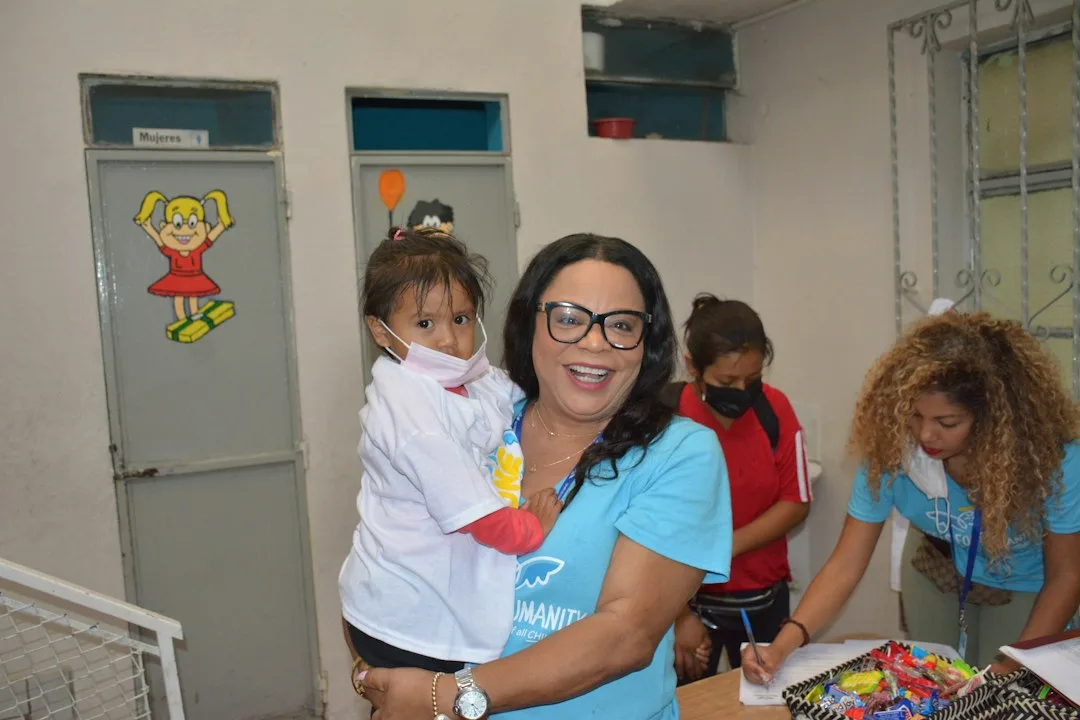
The Semi-Absentee Trap: Why Childcare Franchising Punishes the Investor Who Doesn’t Show Up
Primrose's $509K EBITDA assumes no owner salary. Add $150K and the math changes. Add absence and enrollment erodes. Why childcare demands on-site ownership.
Read →
EBITDA vs EBITDAR: The $315,000 Gap That Flatters Every Childcare Franchise Comparison
Primrose reports 29% EBITDAR and 18% EBITDA. The $315K difference is rent — and any comparison ignoring it flatters the model by a third of a million dollars.
Read →
The Recruitment Playbook: How Primrose Owners Who Solve the 40% Turnover Problem Build an Unkillable Competitive Moat
40% annual turnover costs Primrose owners $28K–$56K/year. The recruitment and retention playbook that cuts churn to 15% and builds an enrollment moat.
Read →September 2026
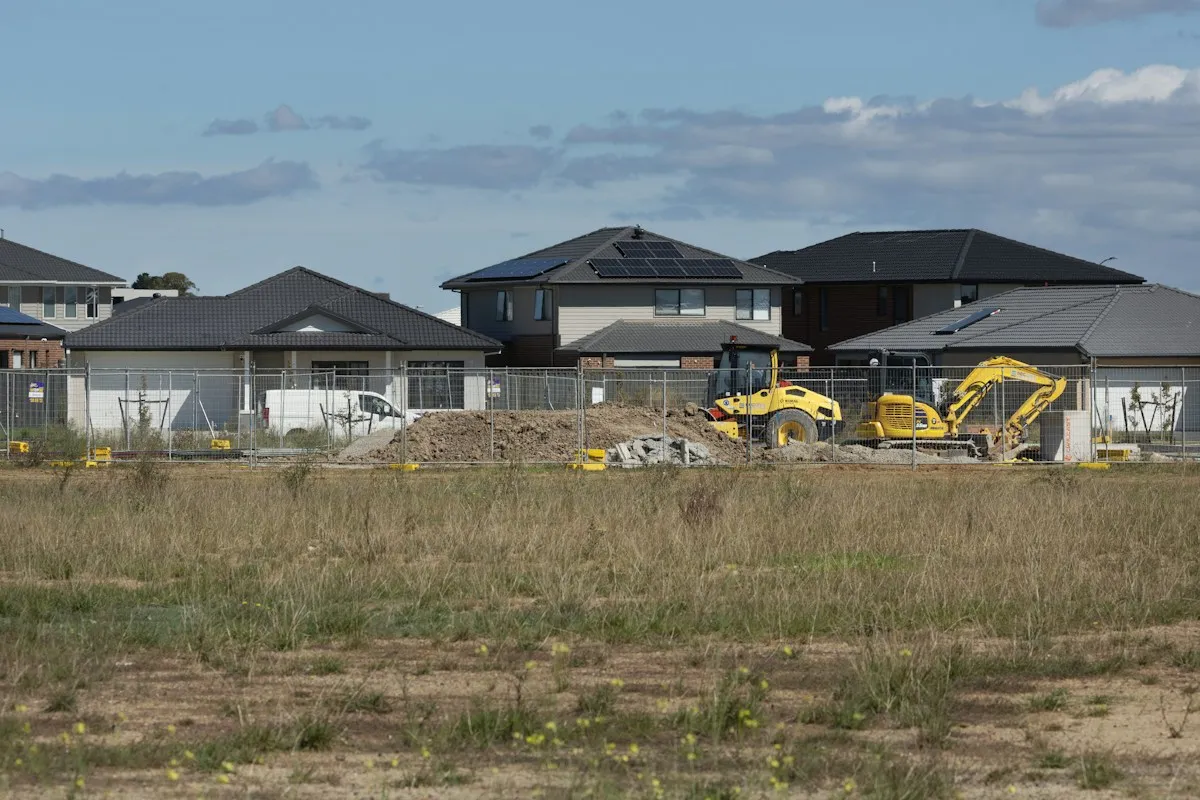
The $785K Variable: How Your Real Estate Decision Sets the Entire Primrose Investment Equation
Build-to-suit at $637K or new-build at $6.8M — three paths, three fundamentally different investments. How the real estate decision shapes your entire Primrose P&L.
Read →
The Growth Architect: What David Berg’s European Wax Center Playbook Tells You About Primrose’s Next Five Years
David Berg scaled European Wax Center 69% in 6 years. Now he runs Primrose. But childcare scaling breaks every assumption from beauty franchising. Here's why.
Read →
The Universal Pre-K Squeeze: When the Government Competes for Your Most Profitable Age Cohort
22+ states offer free pre-K for your highest-margin age group. Model the enrollment and margin impact before selecting a Primrose franchise territory.
Read →
The Payroll Ceiling: Why 45% of Revenue Is a Floor, Not a Budget Line, and What Happens When It Hits 50%
State-mandated ratios fix Primrose payroll at 45% of revenue. Model what happens at 48% and 50% — where $147K in EBITDA evaporates.
Read →
The Liability Iceberg: Why One Abuse Allegation Costs $200K Even When You’re Innocent — And Why Your Insurance Probably Won’t Pay
Standard GL policies exclude abuse claims. One unfounded allegation: $200K defense costs, 30% enrollment loss, potential closure. What your insurance stack actually needs.
Read →
The CCDF Cliff: How the May 2026 Federal Childcare Subsidy Rollback Creates a New Revenue Risk Layer
Attendance-based payment, co-pay cap removal, and federal funding cuts. How the May 2026 CCDF rollback creates a new revenue risk for every childcare franchise investor.
Read →
The 2026 FDD Update: What CY2025 Data Reveals About Primrose’s Growth-Without-Gains Problem
The 2026 FDD shows AUV flat at $2.66M, top quartile revenue down 5.9%, and profitability concentrating at the top. What the CY2025 data changes about your investment thesis.
Read →
The Fee Stack: What the 7% Royalty Doesn’t Tell You About Primrose’s Real 11–13% Revenue Burden
Four separate fees stack to 11–13% of gross revenue — $300K–$355K/year at average revenue. Here’s every layer the comparison sites miss.
Read →
The Ownership Reset: What Roark Capital’s Exit and Taurus Capital Partners’ Takeover Mean for Your Primrose Investment
Roark Capital sold Primrose after 18 years. Taurus Capital Partners owns both the franchisor AND a Primrose franchisee. What the March 2026 deal changes for buyers.
Read →
The October 1 Reset: How SBA SOP 50 10 8.1 Rewrites the Financing Playbook for Primrose Buyers
DSCR rises to 1.25x, QoE mandatory at $3M+, projections dead for acquisitions. What the October 1 SBA reset means for your Primrose financing plan.
Read →
The Quartile Trap: Why Primrose’s $2.73M Average Revenue Hides a 2.1x Spread That Changes Every Calculation
55% of Primrose locations fall below the $2.73M average. See the quartile-by-quartile P&L breakdown — and what bottom-25% economics actually look like.
Read →